
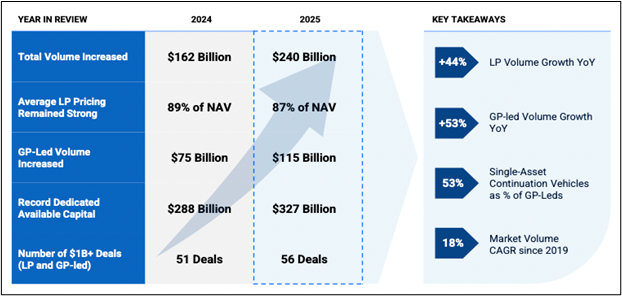
The global secondary market reached $240 billion in transaction volume in 2025, a 48 percent year-over-year increase that surpassed expectations and marked the largest year on record. That followed a record-breaking 2024.
Activity accelerated as the year progressed, with $137 billion in volume in the second half alone. Strong buyside demand, supported by rising levels of dedicated secondary capital and new market entrants, met a steady supply of LP portfolios and GP-led opportunities, as both investors and sponsors continued to prioritize liquidity and active portfolio management.
LP Market: Larger Transactions and an Evolving Buyer Base
LP-led transactions totaled $125 billion in 2025, representing 52 percent of total secondary market activity. Volume was driven by LPs selling diversified portfolios to accelerate liquidity and manage overallocations in a low-distribution environment. Activity increased especially in the second half of the year, with $69 billion of volume in H2 alone, evidence of continued strong momentum. Additionally, transaction sizes continued to scale in 2025, with 27 LP deals exceeding $1 billion and the largest LP market transaction surpassing $5 billion.
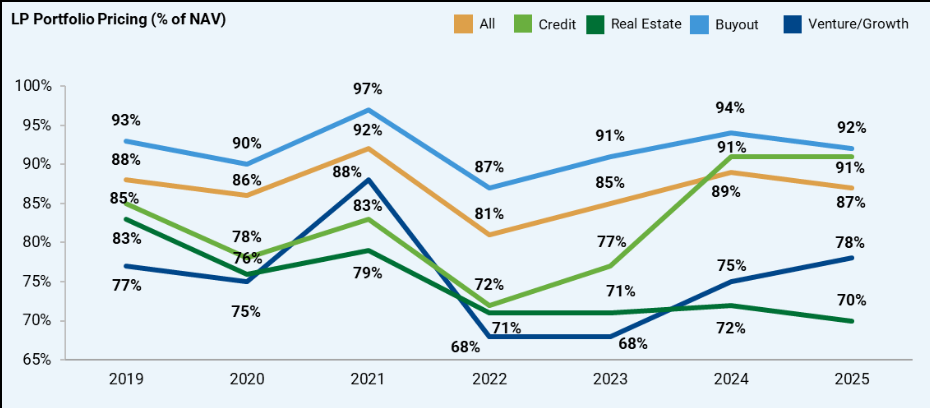
Average LP portfolio pricing finished the year at 87 percent of net asset value (NAV), a 200-basis-point decline from 2024. The decline reflected an older vintage mix of buyout portfolios and a larger share of venture and growth activity. Buyout portfolios brought to market skewed older, with an average vintage of 2016 compared with 2018 in 2024. By strategy, buyout pricing declined to 92 percent of NAV, venture and growth pricing increased to 78 percent, credit pricing remained stable at 91 percent, and real estate pricing declined to 70 percent of NAV.
Pricing also varied by fund age. The weighted average vintage sold across strategies was 2018. Funds less than five years old priced at an average of 95 percent of NAV, while tail-end funds more than ten years old priced at 73 percent of NAV. LP transactions continued to incorporate structuring solutions, with deferred pricing used in approximately 23 percent of transactions and improving pricing relative to full-cash deals.
GP Market: Continued Expansion Across Sponsors and Strategies
GP-led secondary volume reached $115 billion in 2025, representing a 53 percent increase year over year and accounting for 48 percent of total secondary market activity. Continuation vehicles (CVs) comprised the majority of GP-led transactions, with activity spanning buyout, venture and growth, credit, and real assets strategies. GP-led volume in the second half of the year ($68 billion) alone nearly matched full-year 2024 levels ($75 billion).
Transaction sizes increased alongside volume. The average CV size rose in 2025 to approximately $900 million, and the number of GP-led transactions exceeding $1 billion increased to 29, materially above 21 $1 billion plus transactions in 2024. Capital availability, higher lead-investor check sizes, and increased participation from traditional LPs and evergreen vehicles supported the execution of larger transactions.
Adoption of CVs also continues to broaden. As of 2025, nearly 80 percent of the top 100 sponsors by assets under management had completed a CV transaction. Even more notably, GP-led secondaries represented approximately 14 percent of all sponsor-backed exit volume in 2025, even as traditional M&A and IPO activity improved in the second half of the year.
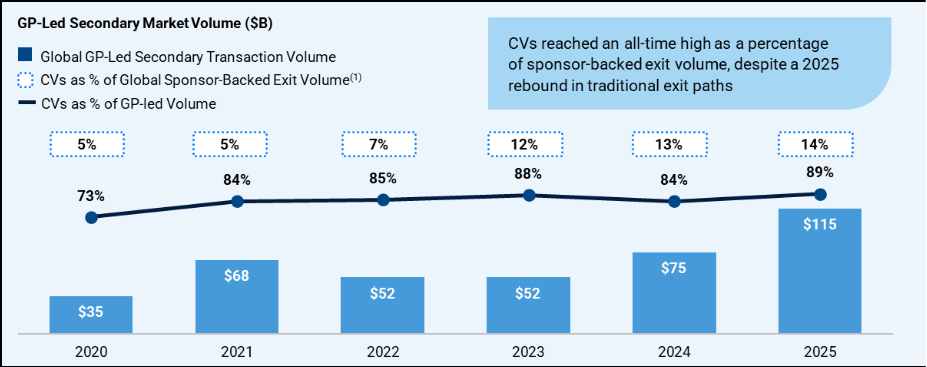
FN: Source: Dealogic estimates for sponsor-backed exit deal volume, including M&A and IPO proceeds. Percentage represents CV transaction volume (numerator) over sponsor-backed exit deal volume (denominator).
Strategy-Level Activity and Structuring
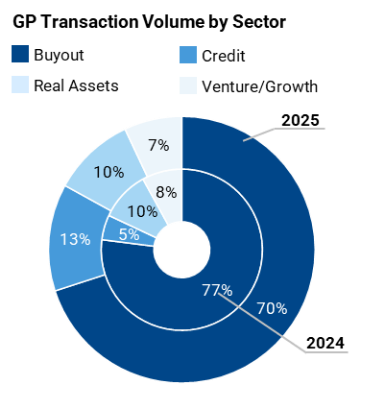
Buyout strategies remained the largest component of GP-led activity, representing approximately 70 percent of GP-led transaction volume. Tech, business services, industrials, and healthcare were the most active sectors within buyout transactions, accounting for over half of overall deal flow. GP-led buyout activity continued to focus on established sponsors and “trophy” assets. Single-asset CVs targeting “trophy” assets continued to gain popularity, exceeding 50% of total CV volume for the first time in 2025.
Venture and growth GP-led transactions remained an important component of the secondary market in 2025. Activity reflected continued liquidity pressures and prolonged distribution cycles, with sponsors using GP-led processes to provide liquidity while maintaining exposure to high-conviction assets. Investor interest focused on later-stage companies and assets benefiting from secular trends, including AI adoption and cloud infrastructure.
Credit GP-led secondaries expanded materially in 2025, with volumes more than tripling since 2024. GP-led transactions also accounted for the majority of credit secondary volume for the first time. Activity was concentrated in sponsor-backed direct lending portfolios and supported by capital from dedicated credit secondary funds, traditional LPs, and evergreen vehicles. Real assets GP-led activity also increased, particularly in energy and infrastructure, as sponsors used continuation vehicles to retain ownership of mature assets.
Structured solutions featured prominently in GP-led transactions. Deferred purchase price mechanisms and other similar structural features were incorporated into approximately 29 percent of GP-led transaction volume in 2025, representing an increase from the prior year.
Capital Availability and Market Participation
Dedicated secondary capital reached a record $327 billion in 2025, reflecting a 14 percent increase from year-end 2024. When combined with capital from traditional LPs and available leverage, total secondary market capital reached approximately $477 billion. Closed-end dedicated secondary fundraising represented 18 percent of all private capital raised during the year, and three of the ten largest private equity funds closed in 2025 were secondary-focused vehicles.
Evergreen vehicles continued to grow as a source of capital for the secondary market. In 2025, evergreen vehicles accounted for an estimated $113 billion of total capital inflows, with approximately 41 percent allocated to secondaries. These vehicles participated across LP and GP-led transactions, including continuation vehicles, diversified portfolios, and structured transactions, contributing to transaction velocity and execution capacity.
Buyer participation also continued to broaden. While large secondary platforms remained highly active, their share of total capital deployment declined for the second consecutive year. The top-10 investors only made up 50 percent of transaction volume in 2025. Smaller-scale buyers, sector specialists, ’40-Act capital, and new entrants increased participation across transaction sizes, particularly in small- and mid-sized deals. These transactions under $250 million accounted for 41 percent of deal count and 13 percent of total volume.
Expectations for 2026: Another Record Year
Entering the new year, Jefferies sees the strongest structural support for continued expansion in the secondary market’s history.
Based on transaction backlog alone, first-half 2026 volume is expected to exceed $100 billion. The firm expects continued supply of LP portfolios and GP-led transactions, supported by sustained liquidity needs, continued sponsor adoption of continuation vehicles, and a well-capitalized buyer base.
Looking ahead, Jefferies sees a path for annual secondary market volume to approach $300 billion over the next 12 to 24 months. Jefferies also anticipates continued growth in strategy specialization among investors and advisors as the market continues to scale. With expanding participation across asset classes and investor types, secondary markets are expected to remain an active area of private capital activity in 2026.