
This will be the first publication in a series of articles by Jefferies Credit Partners designed to bring investors under the hood of underwriting private credit.
Private credit has rapidly evolved from a niche asset class into a significant force in the global lending landscape. It has grown at a rate of 15.6% per year between 2018 – 2024 and is projected to grow from a $2.1 trillion sector at 2024-end to an estimated $4.5 trillion by 20301.
Private credit may offer superior yields, bespoke deal structures, and a favorable risk-return profile, having delivered an annualized return of 9-10% with low standard deviation over the last two decades as measured by Cliffwater Direct Lending Index 2. Across several different credit cycles, sponsor-backed loans have maintained lower default rates than non-sponsor-backed loans3.
As investor interest in private credits grows, so too does the imperative of selecting the right manager, with the right process, to evaluate a potential borrower’s strengths and weaknesses.
One common way that many direct lenders run unnecessary risk is when they are overly reliant on EBITDA measures that don’t provide a clear view into a business’s cash flow or creditworthiness. In the process, they are exposing credit investors to more risk than they bargained for, especially amid rising global geopolitical and economic risks.
At issue is the Interest Coverage Ratio (ICR), which, like a P/E ratio, has the virtue of simplicity, and is commonly referenced as a predictor of a company’s creditworthiness.
Interest Coverage Ratio = Adjusted EBITDA / Interest Expense
Interest Coverage Ratio is a widely marketed metric in presentations, loan tapes, and diligence files for investors. However, the real standard that most lenders focus on, and investors should direct their attention to, is the Fixed Charge Coverage Ratio (FCCR). While being a useful proxy, we note that ICR can obscure more than it illuminates, by relying on an Adjusted EBITDA figure that does not answer the most critical question for every credit investor: Is this company generating enough free cash flow to service its debt?
EBITDA is increasingly subject to manipulation with companies adjusting it higher by, among other factors:
- Including pro forma cost savings or synergies
- Making run-rate or ramp adjustments – for example, including new stores or products that are not yet operational or profitable, or pulling forward revenue from contracts
- Classifying expenses such as recruiting, growth marketing spends, restructuring, and other employee costs (e.g., severance, legal, etc.) as ‘one-time costs’
Many leveraged loan credit agreements have an EBITDA definition that includes several pages of addbacks and adjustments, resulting in a materially higher “Adjusted EBITDA.” Interest coverage also does not account for capital expenditures, cash taxes, sponsor management fees, and other “below the line” cash costs that do not hit EBITDA, the sum of which can be material.
This is why lenders like Jefferies Credit Partners (“JCP”) rely on a measure called the Fixed Charge Coverage Ratio (FCCR), which they believe makes it more difficult for a company to engineer its way to creditworthiness.
Before delving into the details of FCCR, it’s worth reminding ourselves that credit has an asymmetric return profile, where a good outcome features capped upside (earning your coupon and recovering your principal) and a bad outcome is losing 100% of your principal. Unlike equity investments, credit does not offer winners with outsized returns to offset mistakes. Therefore, our view is that a good credit partner should focus on downside protection, with a disciplined and repeatable underwriting process.
Unpacking the Fixed Charge Coverage Ratio
FCCR is a key tool that is used to judge a company’s free cash flow. Here is how it is measured:
FCCR =
(Adjusted EBITDA – Cash Addbacks – Capex – Cash Taxes – Sponsor Fees – Other Below the Line Cash Costs) / (Interest Expense + Required Principal Amortization)
Note that the denominator in this equation also includes principal payments for the simple reason that this is cash a company does not have available to operate or invest in the business.
Fixed Charge Coverage Ratio (FCCR) vs. Interest Coverage Ratio (ICR)
FCCR often paints a different picture of a company’s creditworthiness than ICR. Consider the following illustrative example of two similarly situated companies, both generating $ 125M of adjusted EBITDA, levered at 5x debt-to-EBITDA with the same interest rate and required amortization schedule. Both have the same Interest Coverage Ratio of 2.2x, while Investment A has a 0.3x higher FCCR due to lower capex requirements and fewer EBITDA adjustments.
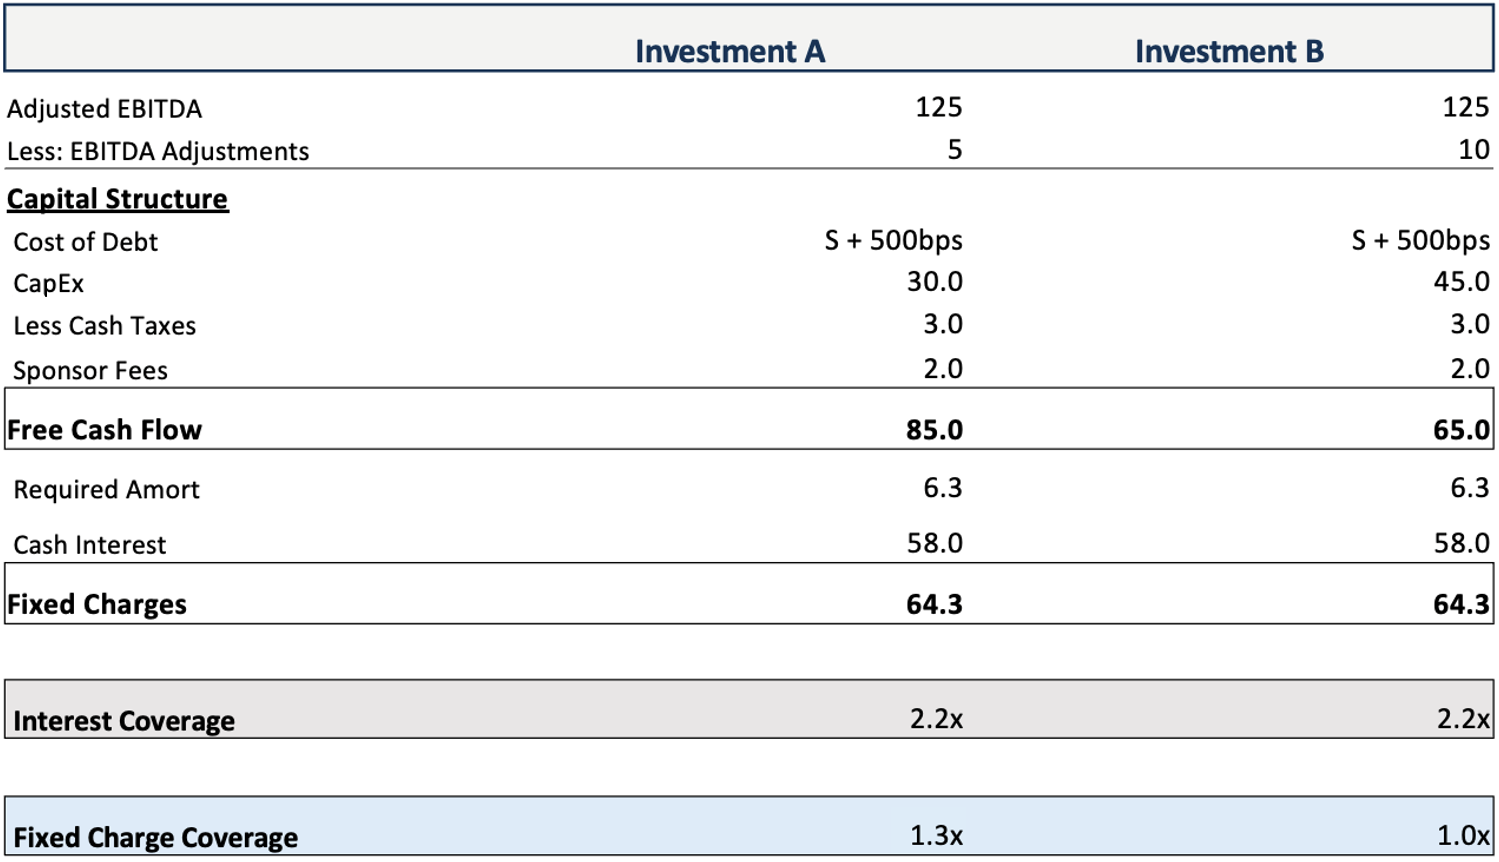
If an investor were presented with these two credit opportunities, it would make sense, all things considered, for them to pursue Investment A over Investment B.
A Metric Credit Investors Need to Know
In recent years, the private credit market has become deeper and more diverse as investors have embraced a growing array of creative debt instruments.
Amid this growing complexity, straightforward and dependable measures of whether a company has the cash to cover its debt are essential. FCCR meets this test and remains a key tool for investors when assessing creditworthiness.
Endnotes:
- Source: Preqin – Private Credit Forecast 2030; Total AuM values relate to year-end figures and are referenced as calculated by Preqin for Global Private Credit (including Direct Lending, Distressed Debt, Other and BDCs, excluding all other semi-liquid funds). AuM figures exclude funds denominated in yuan renminbi.
- Source: Cliffwater 2025 Asset Allocation Report – referencing the Cliffwater Direct Lending Index which represents the actual historical asset class return for the 20 years ending September 30, 2024; gross of fees, on an unlevered basis.
- Source: LCD – US Leveraged Loan Default Rates (Period reviewed: Jan 2020 to Jul 2025)
Jefferies Credit Partners is a brand name for the asset management business conducted by the following SEC-registered investment advisers: Jefferies Finance, LLC, Jefferies Credit Partners LLC (“JCP”) and Jefferies Credit Management LLC (“JCM”), and together the Jefferies Credit Partners Platform (the “Platform”). Registration of an investment adviser with the SEC does not imply a certain level of skill or training. Jefferies Credit Partners is the investment management division of Jefferies Finance LLC (“Jefferies Finance”), a ~20-year-old joint venture founded in 2004 between Massachusetts Mutual Life Insurance Company (“MassMutual”) and Jefferies Financial Group Inc. (NYSE: JEF) (“Jefferies”). References to Jefferies are intended as Jefferies Financial Group Inc. global investment bank.
Past performance is no guarantee of future results. There is no guarantee that all of these opportunities will be available in the future. This document is furnished on a confidential basis for informational purposes only. The information contained herein must be kept strictly confidential and may not be reproduced or redistributed in any format without the express written consent of Jefferies Credit Partners LLC. These materials do not constitute an offer to sell or a solicitation of an offer to buy shares or limited partnership interests in any fund.
JCP is a division of JFIN. References herein to JCP refer collectively to JFIN, its relying advisers and affiliates. All information provided herein is for informational purposes only to illustrate the background and experience of the JCP investment team, which should not be relied upon to make an investment decision. This information is being furnished by or on behalf of JFIN and JCP on a confidential basis to the Recipient, which, other than on a need to know basis to the Recipient’s professional advisors, cannot be redistributed without the prior written consent of JCP. It is neither an offer to sell nor a solicitation of any offer to buy any securities, investment products or investment advisory services.
Certain statements herein constitute forward looking statements. When used herein, the words “project,” “anticipate,” “believe,” “estimate,” “expect,” “intend,” “target,” and similar expressions are generally intended to identify forward looking statements. Such forward looking statements, including the intended actions and performance objectives referenced herein, involve known and unknown risks, uncertainties, and other important factors that could cause the actual results, performance, or achievements to differ materially from any future results, performance, or achievements expressed or implied by such forward looking statements. Even if presented with numerical specificity, forward-looking financial projections are only predictions based on information currently available to JCP and JCP’s assumptions based on such information. Actual results may differ materially from any forward-looking financial projections contained herein. You are cautioned not to place undue reliance on any forward-looking statements or financial projections. No assurances can be given that the future results as projected will be achieved. All forward looking statements or financial projections in this document speak only as to the date hereof. JFIN expressly disclaims any obligation or undertaking to disseminate any updates or revisions to any forward-looking statements or financial projections contained herein to reflect any change in its assumptions or expectations with regard thereto or any change in events, conditions, or circumstances on which any such statement or projection is based. Furthermore, nothing contained herein is, or should be relied upon as, a promise or representation as to the future performance of any investment, vehicle or account managed or owned by JFIN.
Additional information about JCP and the information contained herein is available upon request.